
Markets and Markets has recently published a report on their view of the hermetic package market worldwide. Has anyone seen it? I’m interested in any opinions, pros or cons of the report. Good information can be very useful, but bad information is worst than no information at all.
Click here for details about the Hermetic Package Market Report.
From the Market and Markets website:
The hermetic packaging market is expected to grow from USD 2.91 Billion in 2016 to USD 4.29 Billion by 2022, at a CAGR of 6.68% during the forecast period. The objectives of the report includes forecast of the hermetic packaging market size in terms of value for multilayer ceramic, metal can, and pressed ceramic packages. Further, it includes the detailed information regarding the drivers of the market such as the need of a packaging method which can protect highly sensitive electronic components for many years and the growing demand of hermetically packaged components from the end-user industries such as automobile electronics and aeronautics and space. It also includes detailed information about the restraints, opportunities, and challenges in the hermetic packaging market. The study of the value chain and analysis of the impact of Porter’s five forces on the market is also one of the objectives of the report which includes the study of the impact of the Porter’s five forces, namely, threat of substitutes, intensity of competitive rivalry, threat of new entrants, bargaining power of buyers, and bargaining power of suppliers on the market.
Years considered for this report:
Base Year: 2015
Estimated Year: 2016
Projected Year: 2022
Forecast Period: 2016–2022
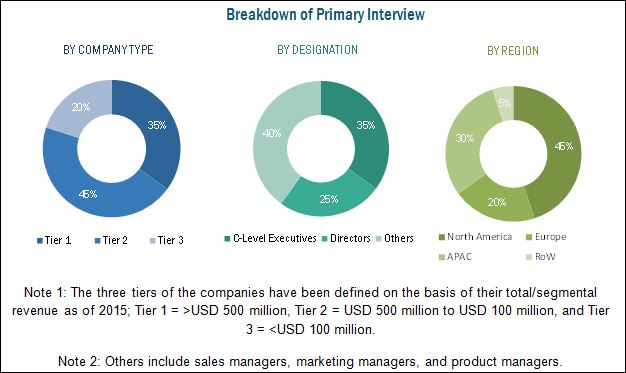
Major players of the hermetic packaging ecosystem were identified across regions, and their offerings, distribution channels, and regional presence is understood through in-depth discussions. Also, average revenue generated by these companies, segmented by region, is used to arrive at the overall hermetic packaging market size. This overall market size is used in the top-down procedure to estimate the sizes of other individual markets through percentage splits from secondary sources directories, databases such as Hoovers, Bloomberg Businessweek, Factiva, OneSource, and primary research. The entire procedure includes the study of the annual and financial reports of the top market players and extensive interview with industry experts such as CEOs, VPs, directors, and marketing executives for key insights.
To know about the assumptions considered for the study, download the pdf brochure
Table of Contents
1 Introduction (Page No. – 14)
1.1 Objectives of the Study
1.2 Market Definition
1.3 Study Scope
1.3.1 Markets Covered
1.3.2 Years Considered for the Study
1.4 Currency
1.5 Limitations
1.6 Stakeholders
2 Research Methodology (Page No. – 18)
2.1 Research Data
2.1.1 Secondary Data
2.1.1.1 Key Data From Secondary Sources
2.1.2 Primary Data
2.1.2.1 Key Data From Primary Sources
2.1.2.2 Key Industry Insights
2.1.2.3 Breakdown of Primaries
2.2 Market Size Estimation
2.2.1 Bottom-Up Approach
2.2.2 Top-Down Approach
2.3 Market Breakdown and Data Triangulation
2.4 Research Assumptions
3 Executive Summary (Page No. – 26)
4 Premium Insights (Page No. – 30)
4.1 Opportunities in the Hermetic Packaging Market
4.2 Heremetic Packaging Market, By Country, 2016
4.3 Hermetic Packaging Market Analysis, By Configuration vs End-User Industry
4.4 Market, By Type
4.5 Market, By Application
4.6 Market, By Geography
5 Market Overview (Page No. – 34)
5.1 Introduction
5.2 Market Segmentation
5.2.1 Hermetic Packaging Market, By Configuration
5.2.2 Market, By Type
5.2.3 Market, By Application
5.2.4 Market, By End-User Industry
5.3 Market Dynamics
5.3.1 Drivers
5.3.1.1 Adoption of Hermetic Packaging for Protecting Highly Sensitive Electronic Components
5.3.1.2 Growing Demand From the End-User Industries Such as Automobile Electronics and Aeronautics & Space
5.3.2 Restraint
5.3.2.1 Stringent Military Standards for Hermetic Packaging
5.3.3 Opportunities
5.3.3.1 Increasing Adoption of Hermetic Packaging for Protection of the Electronic Implantable Medical Devices From Human Body Fluids
5.3.3.2 Rising Demand From Countries in APAC for Hermetically Packaged Components and ICS for Myriad Applications
5.3.4 Challenge
5.3.4.1 High Infrastructure Cost Incurred By Controlled and Regulated Packaging Environment
6 Industry Trends (Page No. – 41)
6.1 Introduction
6.2 Hermetic Packaging in the Food & Beverages Industry
6.2.1 Vacuum Packages
6.3 Hermetic Packaging in the Pharmaceutical Industry
6.4 Value Chain Analysis
6.5 Porter’s Five Forces Analysis: 2015
6.5.1 Threat of New Entrants
6.5.2 Threat of Substitutes
6.5.3 Bargaining Power of Buyers
6.5.4 Bargaining Power of Suppliers
6.5.5 Intensity of Competitive Rivalry
7 Hermetic Packaging Market, By Configuration (Page No. – 52)
7.1 Introduction
7.2 Multilayer Ceramic Packages
7.3 Pressed Ceramic Packages
7.4 Metal Can Packages
8 Hermetic Packaging Market, By Type (Page No. – 57)
8.1 Introduction
8.2 Passivation Glass
8.3 Reed Glass
8.4 Transponder Glass
8.5 Glass–Metal Sealing (GTMS)
8.6 Ceramic–Metal (CERTM) Sealing
9 Hermetic Packaging Market, By Application (Page No. – 64)
9.1 Introduction
9.2 Transistors
9.3 Sensors
9.4 Lasers
9.5 Photodiodes
9.6 Airbag Igniters
9.7 Oscillating Crystals
9.8 MEMS Switches
9.9 Others
10 Hermetic Packaging Market, By End-User Industry (Page No. – 73)
10.1 Introduction
10.2 Military & Defense
10.3 Aeronautics & Space
10.4 Automotive
10.4.1 Airbag Initiation
10.4.2 Battery Protection
10.4.2.1 Guidelines for Packaging and Shipping Batteries in the U.S.
10.4.3 Rfid Transponder Operation
10.5 Energy & Nuclear Safety
10.5.1 Electrical Penetration Control
10.5.2 Oil & Gas Applications
10.5.3 Fuel Cell Manufacturing
10.6 Medical
10.6.1 Dental Applications
10.6.2 Veterinary Applications
10.7 Telecommunications
10.8 Others
11 Package Closing Techniques for Hermetic Packaging (Page No. – 101)
11.1 Introduction
11.2 Welding
11.2.1 Electrical Resistance Welding
11.2.2 Electrode Welding Or Rolled Seam Welding
11.2.3 Laser Welding
11.2.4 Cold Welding
11.3 Crimp Connection
11.4 Soldering
12 Hermetic Packaging Market, By Geography (Page No. – 104)
12.1 Introduction
12.2 APAC
12.2.1 China
12.2.2 Japan
12.2.3 South Korea
12.2.4 Taiwan
12.2.5 India
12.2.6 Rest of APAC
12.3 North America
12.3.1 U.S.
12.3.2 Canada
12.3.3 Mexico
12.4 Europe
12.4.1 Germany
12.4.2 France
12.4.3 Italy
12.4.4 U.K.
12.4.5 Spain
12.4.6 Rest of Europe
12.5 RoW
12.5.1 South America
12.5.2 Middle East and Africa
13 Competitive Landscape (Page No. – 118)
13.1 Overview
13.2 Market Ranking Analysis
13.3 Competitive Situation and Trends
13.3.1 New Product Launches
13.3.2 Acquisitions
13.3.3 Expansions
13.3.4 Contracts & Agreements
13.3.5 Partnerships
14 Company Profiles (Page No. – 126)
(Company at A Glance, Recent Financials, Products & Services, Strategies & Insights, & Recent Developments)*
14.1 Introduction
14.2 Schott AG
14.3 Ametek, Inc.
14.4 Amkor Technology
14.5 Texas Instruments Incorporated
14.6 Teledyne Microelectronics Technologies
14.7 Kyocera Corporation
14.8 Materion Corporation
14.9 Egide SA
14.10 Micross Components, Inc.
14.11 Legacy Technologies Inc.
14.12 Willow Technologies
14.13 SST International
*Details on Company at A Glance, Recent Financials, Products & Services, Strategies & Insights, & Recent Developments Might Not Be Captured in Case of Unlisted Companies.
15 Appendix (Page No. – 155)
15.1 Discussion Guide
15.2 Knowledge Store: Marketsandmarkets’ Subscription Portal
15.3 Introducing RT: Real-Time Market Intelligence
15.4 Available Customizations
15.5 Related Reports
15.6 Author Details
List of Tables (66 Tables)
Table 1 Hermetic Packaging Market, By Configuration, 2013–2022 (USD Million)
Table 2 Market for Multilayer Ceramic Packages, By End-User Industry, 2013–2022 (USD Million)
Table 3 Market for Pressed Ceramic Packages, By End-User Industry, 2013–2022 (USD Million)
Table 4 Market for Metal Can Packages, By End-User Industry, 2013–2022 (USD Million)
Table 5 Hermetic Packaging Market, By Type, 2013–2022 (USD Million)
Table 6 Market for Passivation Glass, By Application, 2013–2022 (USD Million)
Table 7 Market for Reed Glass, By Application, 2013–2022 (USD Million)
Table 8 Market for Transponder Glass, By Application, 2013–2022 (USD Million)
Table 9 Market for Glass–Metal Sealing (GTMS), By Application, 2013–2022 (USD Million)
Table 10 Hermetic Packaging Market for Ceramic–Metal (CERTM) Sealing, By Application, 2013–2022 (USD Million)
Table 11 Market, By Application, 2013–2022 (USD Million)
Table 12 Market for Transistors, By Configuration, 2013–2022 (USD Million)
Table 13 Market for Sensors, By Configuration, 2013–2022 (USD Million)
Table 14 Market for Lasers, By Configuration, 2013–2022 (USD Million)
Table 15 Market for Photodiodes, By Configuration, 2013–2022 (USD Million)
Table 16 Hermetic Packaging Market for Airbag Igniters, By Configuration, 2013–2022 (USD Million)
Table 17 Market for Oscillating Crystals, By Configuration, 2013–2022 (USD Million)
Table 18 Market for MEMS Switches, By Configuration, 2013–2022 (USD Million)
Table 19 Market for Other Applications, By Configuration, 2013–2022 (USD Million)
Table 20 Hermetic Packaging Market, By End-User Industry, 2013–2022 (USD Million)
Table 21 Market for Military & Defense Industry, By Region, 2013–2022 (USD Million)
Table 22 Market for Military & Defense Industry in APAC, By Country, 2013–2022 (USD Million)
Table 23 Market for Military & Defense Industry in North America , By Country, 2013–2022 (USD Million)
Table 24 Market for Military & Defense Industry in Europe, By Country, 2013–2022 (USD Million)
Table 25 Market for Military & Defense Industry in RoW, By Region, 2013–2022 (USD Million)
Table 26 Market for Aeronautics & Space Industry, By Region, 2013–2022 (USD Million)
Table 27 Market for Aeronautics & Space Industry in APAC, By Country, 2013–2022 (USD Million)
Table 28 Market for Aeronautics & Space Industry in North America, By Country, 2013–2022 (USD Million)
Table 29 Hermetic Packaging Market for Aeronautics & Space Industry in Europe, By Country, 2013–2022 (USD Million)
Table 30 Market for Aeronautics & Space Industry in RoW, By Region, 2013–2022 (USD Million)
Table 31 Market for Automotive Industry, Byregion, 2013–2022 (USD Million)
Table 32 Market for Automotive Industry in APAC, By Country, 2013–2022 (USD Million)
Table 33 Hermetic Packaging Market for Automotive Industry in North America, By Country, 2013–2022 (USD Million)
Table 34 Market for Automotive Industry in Europe, By Country, 2013–2022 (USD Million)
Table 35 Hermetic Packaging Market for Automotive Industry in RoW, By Region, 2013–2022 (USD Million)
Table 36 Market for Energy & Nuclear Safety Industry, By Region, 2013–2022 (USD Million)
Table 37 Market for Energy & Nuclear Safety Industry in APAC, By Country, 2013–2022 (USD Million)
Table 38 Market for Energy & Nuclear Safety Industry in North America, By Country, 2013–2022 (USD Million)
Table 39 Hermetic Packaging Market for Energy & Nuclear Safety Industry in Europe, By Country, 2013–2022 (USD Million)
Table 40 Market for Energy & Nuclear Safety Industry In, By Region, 2013–2022 (USD Million)
Table 41 Hermetic Packaging Market for Medical Industry, By Region, 2013–2022 (USD Million)
Table 42 Market for Medical Industry in APAC, By Country, 2013–2022 (USD Million)
Table 43 Market for Medical Industry in North America, By Country, 2013–2022 (USD Million)
Table 44 Market for Medical Industry in Europe, By Country, 2013–2022 (USD Million)
Table 45 Hermetic Packaging Market for Medical Industry In, By Region, 2013–2022 (USD Million)
Table 46 Market for Telecommunication Industry, By Region, 2013–2022 (USD Million)
Table 47 Market for Telecommunication Industry in APAC, By Country, 2013–2022 (USD Million)
Table 48 Hermetic Packaging Market for Telecommunication Industry in North America, By Country, 2013–2022 (USD Million)
Table 49 Market for Telecommunication Industry in Europe, By Country, 2013–2022 (USD Million)
Table 50 Market for Telecommunication Industry in RoW, By Region, 2013–2022 (USD Million)
Table 51 Market for Other End-User Industries, By Region, 2013–2022 (USD Million)
Table 52 Hermetic Packaging Market for Other End-User Industries in APAC, By Country, 2013–2022 (USD Million)
Table 53 Market for Other End-User Industries in North America, By Country, 2013–2022 (USD Million)
Table 54 Market for Other End-User Industries in Europe, By Country, 2013–2022 (USD Million)
Table 55 Hermetic Packaging Market for Other End-User Industries in RoW, By Region, 2013–2022 (USD Million)
Table 56 Market, By Region, 2013–2022 (USD Million)
Table 57 Market in APAC, By Country, 2013–2022 (USD Million)
Table 58 Market in North America, By Country, 2013–2022 (USD Million)
Table 59 Hermetic Packaging Market in Europe, By Country, 2013–2022 (USD Million)
Table 60 Market in RoW, By Region, 2013–2022 (USD Million)
Table 61 Market Ranking of the Top 5 Players in the Hermetic Packaging Market, 2015
Table 62 New Product Launches, 2014–2016
Table 63 Acquisitions, 2014–2016
Table 64 Expansions, 2014–2016
Table 65 Contracts & Agreements, 2014–2016
Table 66 Partnerships, 2014–2016
List of Figures (62 Figures)
Figure 1 Market Segmentation
Figure 2 Hermetic Packaging Market: Research Design
Figure 3 Market: Bottom-Up Approach
Figure 4 Market: Top-Down Approach
Figure 5 Data Triangulation
Figure 6 Market for Micro-Electro-Mechanical Systems (MEMS) Switches Expected to Grow at the Highest Rate During the Forecast Period
Figure 7 Ceramic–Metal (CERTM) Sealing Expected to Hold Major Share of the Market During the Forecast Period
Figure 8 APAC Expected to Hold the Largest Share of the Market in 2016
Figure 9 Aeronautics & Space Expected to Be the Fastest-Growing Industry in the Market During the Forecast Period
Figure 10 Significant Opportunities for Developing Countries in the Market During the Forecast Period
Figure 11 Market in APAC Expected to Grow at A Significant Rate During the Forecast Period
Figure 12 Military & Defense Industry Likely to Hold A Major Share of the Hermetic Packaging Market in 2016
Figure 13 CERTM Expected to Lead the Market During the Forecast Period
Figure 14 Transistors Expected to Lead the Market During the Forecast Period
Figure 15 APAC Expected to Dominate the Hermetic Packaging Market During the Forecast Period
Figure 16 Market, By Geography
Figure 17 Market Dynamics: Overview
Figure 18 Value Chain Analysis (2015): Major Value Added During Research & Development and Manufacturing Phase
Figure 19 Porter’s Five Forces Analysis: 2015
Figure 20 Porter’s Five Forces: Impact Analysis
Figure 21 Porter’s Five Forces: Threat of New Entrants
Figure 22 Porter’s Five Forces: Threat of Substitutes
Figure 23 Porter’s Five Forces: Bargaining Power of Buyers
Figure 24 Porter’s Five Forces: Bargaining Power of Suppliers
Figure 25 Porter’s Five Forces: Intensity of Competitive Rivalry
Figure 26 Market for Multilayer Ceramic Packages Expected to Grow at the Highest Rate During the Forecast Period
Figure 27 Market for Ceramic–Metal Sealing Expected to Grow at the Highest Rate During the Forecast Period
Figure 28 Market for MEMS Switches to Grow at the Highest Rate During the Forecast Period
Figure 29 Multilayer Ceramic Packaged MEMS Switches Expected to Lead the Market During the Forecast Period
Figure 30 Aeronautics & Space Industry Expected to Witness the Highest Growth Rate During the Forecast Period
Figure 31 Market for Military & Defense Industry in APAC Expected to Grow at the Highest Rate During the Forecast Period (USD Million)
Figure 32 Market for Aeronautics & Space Industry in India Expected to Grow at the Highest Rate During the Forecast Period (USD Million)
Figure 33 European Market for Automotive Industry in Germany Expected to Grow at the Highest Rate During the Forecast Period
Figure 34 Hermetic Packaging Market for Energy & Nuclear Safety in Canada Expected to Grow at the Highest Rate Between 2016 and 2022 (USD Million)
Figure 35 Market for Medical Industry in APAC Expected to Grow at the Highest Rate During the Forecast Period
Figure 36 Hermetic Packaging Market for Telecommunication Industry Expected to Grow at the Highest Rate in India During the Forecast Period (USD Million)
Figure 37 Market for Other Industries Expected to Grow at the Highest Rate in Spain During the Forecast Period
Figure 38 Electrical Resistance Welding
Figure 39 Wheel-To-Base Process of Rolled Seam Welding
Figure 40 Wheel-To-Wheel Process of Rolled Seam Welding
Figure 41 Laser Welding
Figure 42 Hermetic Packaging Market in APAC Expected to Grow at the Highest Rate During Forecast Period
Figure 43 APAC Expected to Lead the Global Hermetic Packaging Market During the Forecast Period
Figure 44 Snapshot of the Hermetic Packaging Market in APAC
Figure 45 Snapshot of the Market in North America
Figure 46 Snapshot of the Market in Europe
Figure 47 Hermetic Packaging : Market Players Adopted New Product Launches as A Key Strategy for Business Expansion
Figure 48 Business Strategies Adopted By the Major Players in the Hermetic Packaging Market Between 2014 and 2016
Figure 49 New Product Launches is the Key Growth Strategy Adopted Between 2014 and 2016
Figure 50 Geographic Revenue Mix of Major Players
Figure 51 Schott AG: Company Snapshot
Figure 52 Schott AG: SWOT Analysis
Figure 53 Ametek, Inc.: Company Snapshot
Figure 54 Ametek.Inc: SWOT Analysis
Figure 55 Amkor Technology: Company Snapshot
Figure 56 Amkor Technology: SWOT Analysis
Figure 57 Texas Instruments Incorporated: Company Snapshot
Figure 58 Texas Instruments Incorporated: SWOT Analysis
Figure 59 Teledyne Microelectronics Technologies: SWOT Analysis
Figure 60 Kyocera Corporation: Company Snapshot
Figure 61 Materion Corporation: Company Snapshot
Figure 62 Egide SA: Company Snapshot